How to do MoM and YoY comparison in GA4?
In this post, you’ll learn how to run month-over-month (MoM) and year-over-year (YoY) comparisons in GA4. Here is a two step way to do it:
- Choose the report you want to compare (standard or custom reports).
- Turn on the comparisons for your chosen date range.
In this example, we’ll compare page views, so we’ll use the Pages and screens report.
The steps are the same no matter which GA4 report you use.
Here’s a video that highlights how to do the same:
Table of Contents
Too Long; Didn’t Read
To do MoM and YoY comparison, click on the date range from the top right corner and select “Previous period” or “Previous year”. You can also do custom comparisons to get the data you want.
How to do a Month-over-Month (MoM) comparison in GA4?
To do the comparison, you will have to select either “Previous period (match day of week)” or “Previous period” from the date range menu in any report in GA4.
Here’s how to do a Month-over-Month comparison in your GA4 (Google Analytics 4) property:
- Navigate to your report in the left sidebar. For this example, I will go to the Pages and screens report.
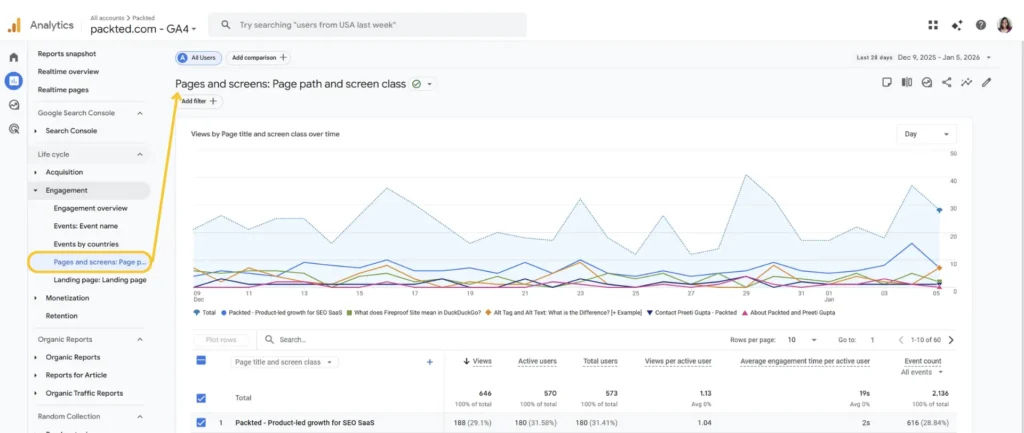
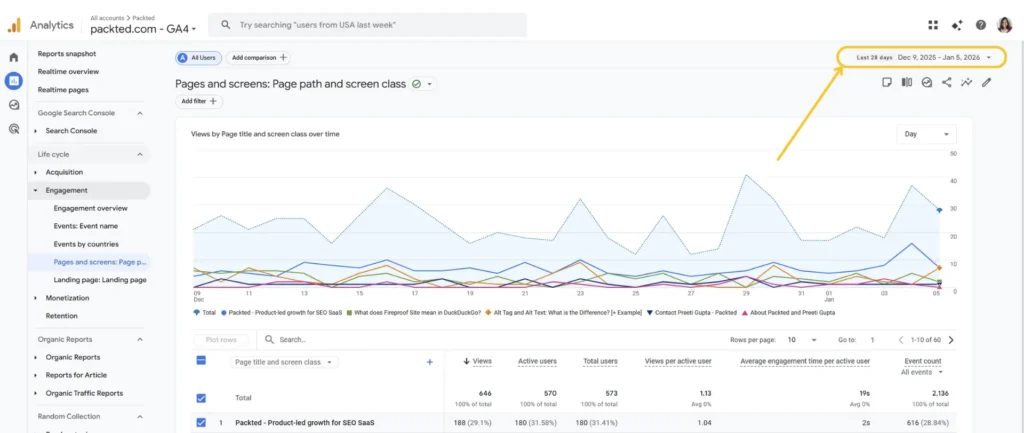
- Click on the date range menu from the top right corner
- Click on compare
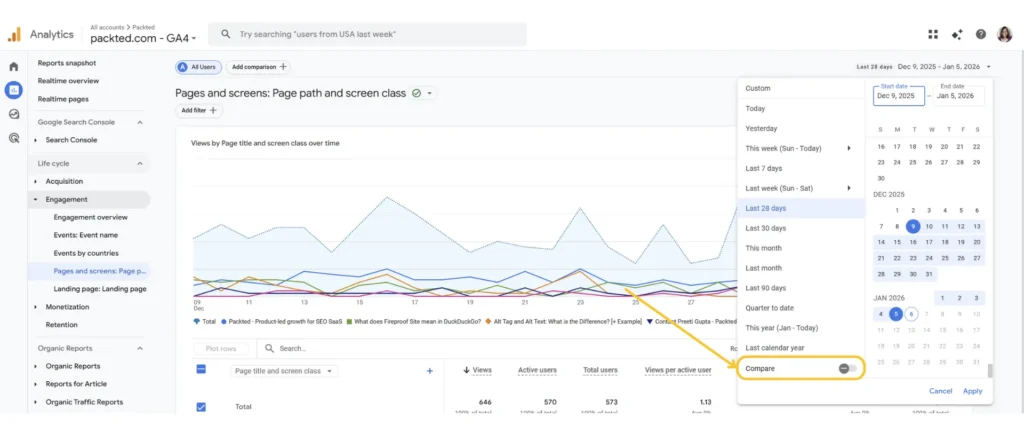
- Here, you will get 4 choices:
– Previous period (match day of week)
– Previous period
– Previous year
To do the MoM comparison, you can select either “Previous period (match day of week)” or “Previous period”. The only difference is that in the “Previous period (match day of week)”, it also matches the day of the week for both the date ranges. For this example, I will choose the “Previous period.”
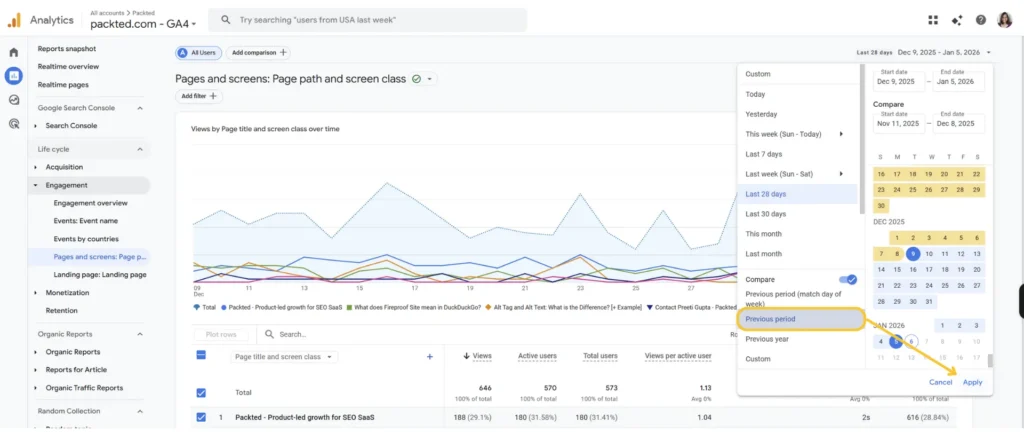
- After clicking Previous period, just hit Apply.
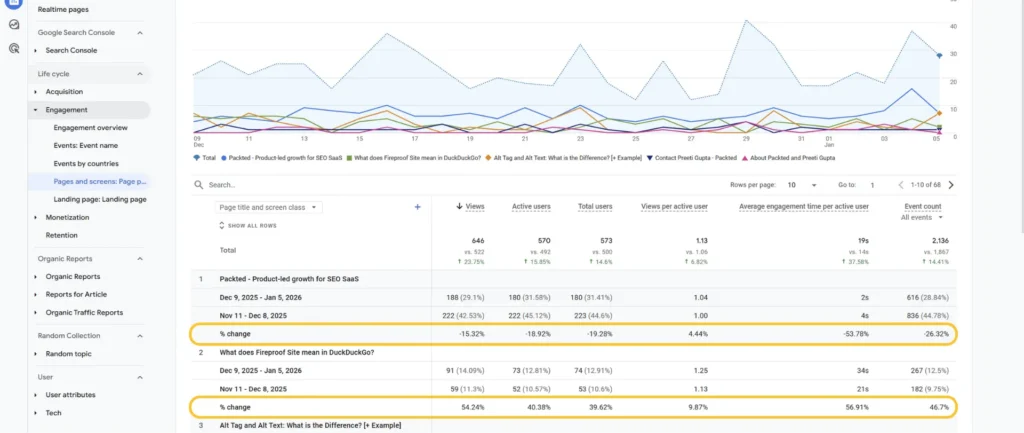
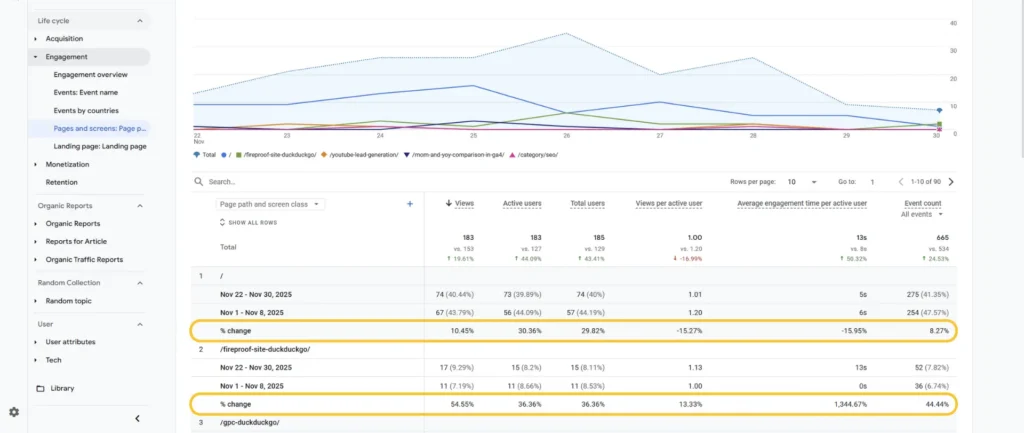
After scrolling down in the report, you will be able to see the month-over-month percent changes.
Now let’s look at how you can do a year-over-year comparison.
How to do a Year-over-Year (YoY) comparison in GA4?
To do the year-over-year comparison, select “Previous year” from the date range menu in the GA4 report.
The process is exactly the same as doing a MoM comparison, but it changes in the fourth step. Let me show you how:
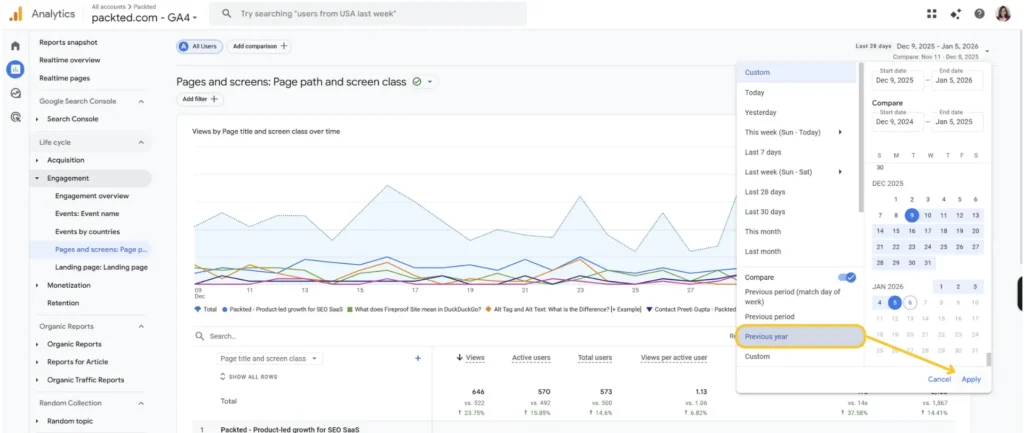
- Navigate to your preferred report in the left sidebar. For this example, I will go to the Pages and screens report.
- Click on the date range
- Click on compare
- Click on “Previous year” and hit Apply.
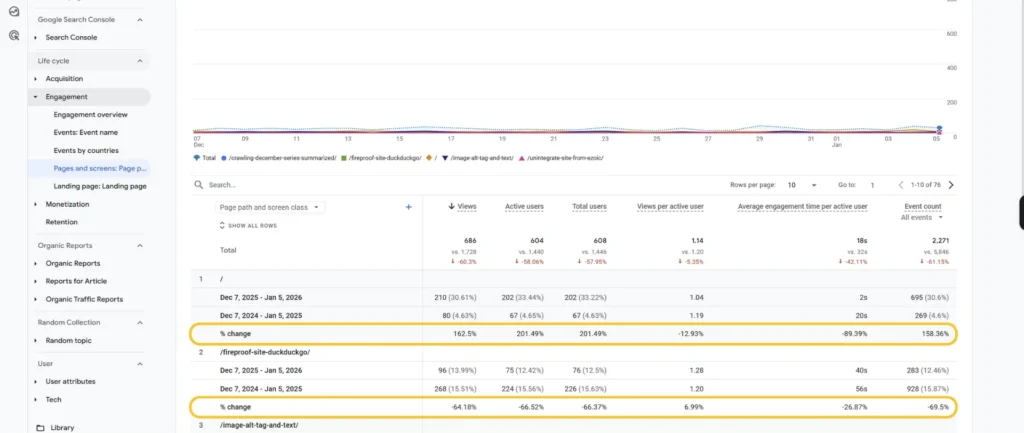
After scrolling down in the report, you will be able to see the year-over-year percent changes.
Bonus: Custom Comparisons In GA4
With custom data comparison, you can compare any range. For example, you’re looking to compare one particular week in this month to another month. Or you can compare different quarters.
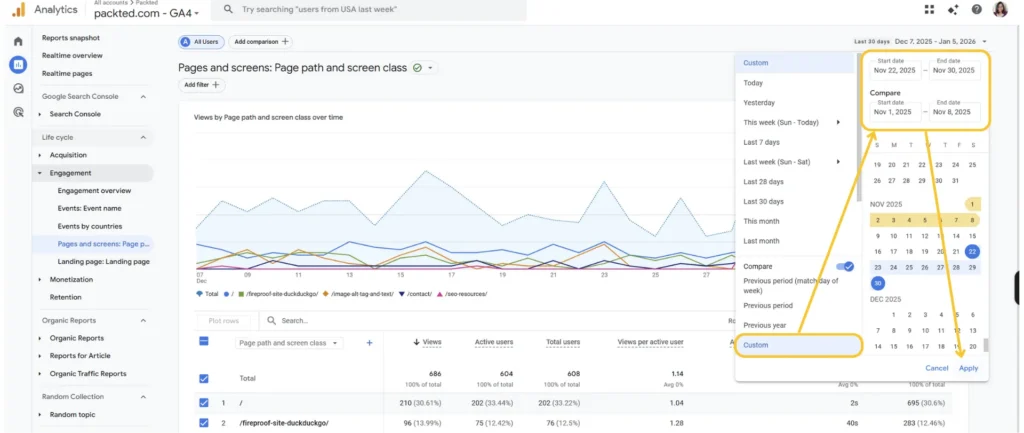
To do that, click on date range and then click on Custom.
Now choose your date range. For this example, I am comparing two different weeks in November. After choosing the date range, click on Apply.
After hitting apply, you can see the changes in the report.
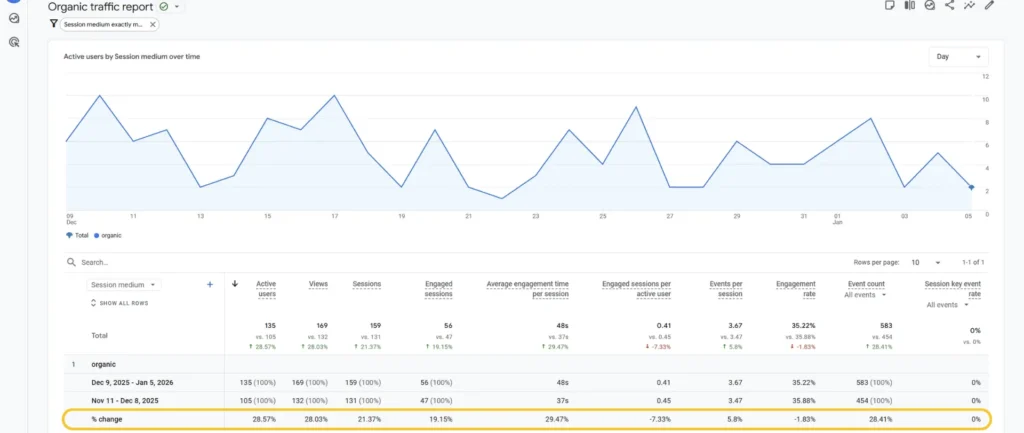
Speaking of custom reports, let’s say you want to report on organic traffic coming only from Google, and you’re targeting a specific country like the US. In that case, create a custom report, apply the MoM comparison, and you’ll see data like this:
Recommended Reading: GA4: Leverage the Power of Custom Reports to Enhance Your Reporting
Final Words
To make custom reports, you will have to choose the Previous period or the Previous year from the date range option. Then you can do the MoM or YoY comparison.
The comparison and custom reports will help you get the most out of your data.